Night Vision For Websites – A Case Study!
Question: Who are all of these visitors, what do they do when they get here, and why are they not converting into paying customers?
A Northern California client came to us for help with increasing leads for their environmental clean-up business. They have a pretty high volume of traffic for a small local business. They receive 30,000+ visitors per month. By looking at Google Analytics, we were able to see that most of the visitors are going to five blog articles discussing Carbon Monoxide and a few other home environmental topics. InfusionSoft is operating in the background, collecting leads, but leads were only trickling in, perhaps just a few per week. We could also see that only 1/6 of users who started the Request A Quote form were completing it. Two thirds of their site traffic comes from the East coast (3000 miles away), and Southern California, so does not represent potential clients. The site has an average on page time of 6 minutes with a bounce rate of 90%. How odd!
What would you do? This is the fun part of our work: playing detective.
Our first objective was to follow the rule that it is cheaper to get business from existing clients than to go out and find new ones. Rather than trying to bring in new traffic, we wanted to try to convert more of their existing traffic, and monetize the traffic from users who are geographically not potential clients. The client would be overbooked if they had 40 projects in a month. It certainly should be possible to convert 40 users out of 30,000 into customers!
 The Never Ending Form
The first thing we did was ask the client about the “Request A Quote” form. Just a tiny percentage of those who started the form actually completed it. Why were people dropping off? How long is the form, we asked? “Six pages long” was the reply. When they created the quote form, the client was concerned that they would be flooded with requests, so they made the Request A Quote form intentionally long as a way to scare off people who didn’t really need help, and required a response for every single question so that only someone who really wanted a call would go through the trouble of filling it out. They certainly were successful in deterring responses! Isn’t that thought process just adorable? We have seen this many times. “Make the user really try hard to reach us because then we know that for sure they want our help so that we don’t waste our time with people who aren’t going to turn into customers”.
We recommended using a short form first, and if calls did in fact start flooding in, THEN adjust. We replaced the six page form with a five question form. Within a week the number of form completions doubled. We are testing this short form and then will test an even shorter form.
By utilizing Google Analytics and heat map technology we were able to determine that there was too much of a barrier to collect qualified leads, and shortened the form, plus removed the annoying pop-up. The high volume of traffic is mostly comprised of actual human users who find the content extremely relevant and compelling. They are not potential clients for the services offered due to their geographic location, but it should be possible to provide additional value to them by making recommendation for trusted products this generate a bit of additional income through affiliate and referral agreements.
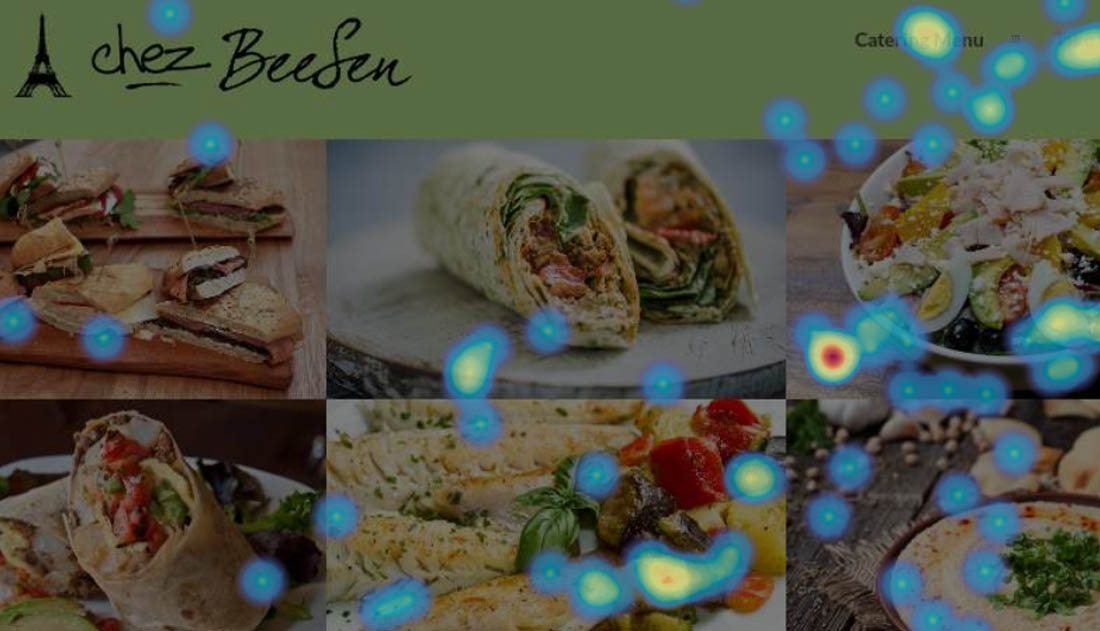
Chez BeeSen, Mediterranean Cuisine

This San Francisco Lunch Spot does catering, and also walk-in orders. We use a heat map to find out what users are interested in, and what they click on. We can see how far down they scroll on the home page, and what the engagement is on desktop vs. mobile.
Bounce Rate And On-Page Time
The next piece of the puzzle is this high number of visits to six of their blog articles. The articles receive several hundred visitors per day. An SEO analyst had told them that the traffic was all bots. We disagreed, based on what we saw in the data and “sensed”. But how do we know for sure? How can we solve this mysterious data showing long on-page times yet a high bounce rate? It appeared from our initial examination that these are real users who land at these blog entries, read the ENTIRE thing, and then leave. We didn’t think they were bots. But to try to engage with these anonymous users, and to know for certain that they are real, we had to learn more than we could get from Google Analytics.
This is where the heat maps and user trails come in. What we learned was incredibly valuable. When we studied reports made on the carbon monoxide blog article, a stunning 75% of users scrolled all the way to the bottom of the page reading carefully and slowly. By recording over 100 user’s movements, we were able to see that the opt-in pop-up was a huge annoyance, yet it didn’t send them running, they simply closed it and continued reading all the way to the end. They often scrolled up to read a section again. Folks! We have real users here! Plus, they find the information in the article so compelling that they read the entire thing!
Summary
By utilizing Google Analytics and heat maps, we were able to determine that there was too much of a barrier for users to request a quote. We removed the pop-up and reduced the Request A Quote form to just a few questions. The high volume of traffic was found to be actual humans, who find the information in the article very compelling and relevant. They are not potential customers due mainly to their geographic location, but it should be possible to engage them in other was such as through affiliate agreements or referrals to businesses that are located in their area.


